Drew Haugen Profile Banner
Drew Haugen Profile
Drew Haugen

@Drew_Haugen

2,097
Followers
136
Following
216
Media
896
Statuses

Quantitative Analyst Associate @Phillies | Analyst at @downonthefarm12 | #rstats and data science enthusiast | BYU fan

Houston, TX
Joined April 2020
Don't wanna be here? Send us removal request.
Pinned Tweet
@Drew_Haugen
Drew Haugen
2 months
I'm thrilled to announce that I'll be spending this summer as a Quantitative Analyst Associate with the Philadelphia Phillies! Go Phils! #RingTheBell
Tweet media one
39
10
233
@Drew_Haugen
Drew Haugen
9 months
Assuming league-average pitch shape, up and away on the corner at 92 vs. middle-middle FF at 97: xRV/100: -1.67 vs. -2.27 The 97 MPH fastball thrown middle-middle would be ~0.6 runs better per 100 pitches than a 92 MPH fastball spotted on the corner.
Tweet media one
Tweet media two
@Brent_Rooker12
Brent Rooker
9 months
Now you’re not comparing apples to apples. We’re not talking about a deadzone 97 mph middle vs a 92 mph elite sinker that’s being tunneled with other pitches. We’re talking two 4 seams with = metrics i.e. spin, extension, HB and IVB. 97+ middle is more challenging than 92 corner.
25
26
1K
5
24
203
@Drew_Haugen
Drew Haugen
1 year
Grayson Rodriguez looks legit. All 5 of his pitches had Stuff+ marks above 110 and he had elite fastball command (117 Location+) last night, which is especially difficult in an MLB debut. If he can improve the breaking stuff command, he's a top-10 starting pitcher in baseball.
Tweet media one
Tweet media two
6
33
198
@Drew_Haugen
Drew Haugen
1 year
Yordan Alvarez mashes no matter what you throw him. This Ohtani sweeper had a 222 Stuff+, 133 Pitching+ and -3.35 xRV. That's the 7th highest Stuff+ of any pitch hit for a homer in 2023. Unsurprisingly, Alvarez is the best hitter in MLB against Stuff+ >= 120 by 85 points of wOBA.
Tweet media one
@astros
Houston Astros
1 year
Yordaddy.
49
926
5K
8
31
183
@Drew_Haugen
Drew Haugen
1 year
Insane piece of hitting right here: - 44% whiff prob (if swung at) - 50% CSW prob - 12% prob of being put in play - 49% ground ball prob (if put in play) - -5.77 xRun Value per 100 pitches - 0.33% prob of being hit for a homer Just gotta tip your cap🤷‍♂️
Tweet media one
@astros
Houston Astros
1 year
YORDAN. 442 FEET.
56
959
6K
5
13
136
@Drew_Haugen
Drew Haugen
1 year
There are differing opinions on how much home runs are under a pitcher's control. FIP looks at pitchers as fully responsible for home runs, whereas xFIP attempts to address some variation by looking at fly balls instead. However, I would like to suggest a new method, p(HR): 🧵
Tweet media one
8
16
119
@Drew_Haugen
Drew Haugen
1 year
With fantasy baseball drafts and spring training approaching, I wanted to create a resource to share my pitch quality metrics, so I put together a web app with the help of #rstats and {shiny}!
Tweet media one
Tweet media two
Tweet media three
Tweet media four
3
16
97
@Drew_Haugen
Drew Haugen
1 year
Stuff+ is great because it stabilizes super fast, especially for fastballs. Already, among fastballs that were thrown at least 250 times last year and 25 times this year, YOY R^2 = 0.65. This means big changes are meaningful, like Kris Bubic's, who added 75 points of Stuff+!!!
Tweet media one
5
10
69
@Drew_Haugen
Drew Haugen
1 year
A look into how pitching staffs have developed, in terms of stuff quality, from 2020 to 2022. The #Yankees have led the league in Stuff+ the past two seasons, while the #RedSox saw the biggest jump in the league from '20 to '22, and the #Dbacks saw the biggest drop-off.
Tweet media one
9
19
63
@Drew_Haugen
Drew Haugen
1 year
Good point here from Anthony, in terms of decrease in Stuff+, the bottom quartile of pitchers in tempo from 2022 have been hurt the most, very likely due to the new pitch clock. Interestingly, there is a non-negligible relationship between pitcher tempo and stuff quality.
Tweet media one
Tweet media two
@MasterTones
Anthony Masterson
1 year
Not a doctor but I don’t think it’s a coincidence that 3 of these guys were the slowest workers from last year
Tweet media one
0
3
21
5
15
63
@Drew_Haugen
Drew Haugen
6 months
I had a theory that not all velo differences are created equal, so I compared Stuff xRV/100 at different velo & velo diff combos (MLB average slider velo diff is ~10 MPH). I found that fast sliders are hurt more by a small velo difference than slow sliders.
Tweet media one
5
11
58
@Drew_Haugen
Drew Haugen
11 months
I've continued to learn python and recently created a simple xRV model. Below is a leaderboard of pitch type xRV+ leaders and a few heatmaps of model predictions (code linked in next tweet):
Tweet media one
Tweet media two
Tweet media three
Tweet media four
@Drew_Haugen
Drew Haugen
1 year
I've been taking a look at python/pandas recently and have finally started to get a bit more comfortable with data manipulation and aggregation, here's a leaderboard of pitcher pitch type CSW% this season, created in pandas:
Tweet media one
6
3
33
5
5
55
@Drew_Haugen
Drew Haugen
1 year
These are the best pitch quality adjusted hitters of 2023 so far. Adam Duvall of the #RedSox has put up elite production while facing high-quality pitching, making his success even more impressive. #Brewers rookie Brice Turang has also excelled against elite pitching.
Tweet media one
@RobertStock6
Robert Stock
1 year
@JonPgh OPS/Stuff+ faced leaderboard? Lol
1
0
2
7
6
55
@Drew_Haugen
Drew Haugen
1 year
I put together an app to share my similarity scores! You can check out both hitter comps and pitcher pitch type comps. Shoutout to @DolphHauldhagen and @NotTheBobbyOrr , their work on similarity scores was the inspiration for this project.
Tweet media one
Tweet media two
Tweet media three
Tweet media four
8
7
50
@Drew_Haugen
Drew Haugen
2 years
This awesome thread inspired me to create a new stat, Wiggle Room+: the amount of area in inches a certain pitcher pitch type can be thrown to and expect good results (a negative xRV), compared to the average for that pitch type. In other words, the blue area on a heat map. 🧵
Tweet media one
Tweet media two
@RylanDomingues
Rylan Domingues
2 years
While stuff dominates the game, if a pitcher cannot at least be somewhat competitive around the zone, then that stuff won't be very useful. An example of the effect that location has on wExecution+ using Aaron Nola's CB - which shows the effectiveness of it as a chase pitch. 🧵
Tweet media one
2
4
49
2
1
50
@Drew_Haugen
Drew Haugen
9 months
With my pitch quality models, I took a look into the quality of pitches a hitter sees through an at-bat. Although pitches earlier in an at-bat tend to have worse stuff, they also tend to be located better, so a hitter is better off waiting for a mistake or trying to work a walk.
Tweet media one
4
9
48
@Drew_Haugen
Drew Haugen
1 year
Only 9 hitters had above-average contact ability, swing decisions, launch angle value, and exit velo value. Some names are expected, like Alvarez, Freeman, and Machado, some are young rising stars like Pasquantino and Murphy, and some are surprises, like Rivera and Arcia.
Tweet media one
5
7
48
@Drew_Haugen
Drew Haugen
1 year
Chase% OE (over expected) factors in difficulty in holding back a swing, and although similar to the actual Chase% leaderboard, it better credits hitters like Brice Turang, who would have been expected to chase ~38% of OOZ pitches but has offered at only 14%.
Tweet media one
@RobertStock6
Robert Stock
1 year
@mike_petriello Would love to see this weighted by how difficult it was to swing or not swing. (Pitch caliber, proximity to zone, count, etc)
1
0
6
6
11
47
@Drew_Haugen
Drew Haugen
1 year
Shane Baz = Jacob deGrom?? For both the FF and SL, deGrom's offerings are in the top 10 most similar pitches. He's set to miss 2023 with TJ surgery, but he'll be a big part of the #Rays future.
Tweet media one
Tweet media two
Tweet media three
Tweet media four
9
5
45
@Drew_Haugen
Drew Haugen
5 months
I've recently been working on rewriting my pitch quality model training script(s) in python and I wanted to share the function I wrote to process statcast data and add all the features I use in modeling (I'm also working on a polars translation):
3
2
42
@Drew_Haugen
Drew Haugen
1 year
I created a blog with Quarto in #rstats ! My first post is a tutorial on working with Statcast data in R, check it out!
Tweet media one
5
10
42
@Drew_Haugen
Drew Haugen
6 months
I've seen multiple people who work in python wishing for mlbplotR-like capabilities, so I adapted some @CFB_Data code to at least plot team logos (such as in the plot below), hopefully someone can use this as a starting point for further development (code in next post)
Tweet media one
2
6
40
@Drew_Haugen
Drew Haugen
3 months
It's hard to draw many conclusions early in the season, but one of my favorite things to look at because of its quickly-stabilizing nature is fastball Stuff+. Here's a look at the pitchers who have improved their fastball the most in 2024:
Tweet media one
@Drew_Haugen
Drew Haugen
1 year
Within the first week of the season, you have a really good idea of how good a pitcher's fastball is. First week Stuff+ has an R^2 of 0.70 with rest of season Stuff+.
Tweet media one
2
3
20
9
4
35
@Drew_Haugen
Drew Haugen
1 year
@tejfbanalytics Save your self some typing with dplyr::case_match() instead: mutate( def_team = case_match( def_team, “Minnesota” ~ “MIN”, “L.A. Chargers” ~ “LAC”, “Las Vegas” ~ “LA”, “Arizona” ~ “ARI” ) )
1
0
36
@Drew_Haugen
Drew Haugen
1 year
The #Dbacks got an absolute weapon in Miguel Castro. He’s got three pitches with elite stuff (his #1 SL comp is Matt Brash🙃) and a deceptive delivery with a 5 ft release point from a 6’7” frame.
Tweet media one
Tweet media two
Tweet media three
Tweet media four
3
1
35
@Drew_Haugen
Drew Haugen
5 months
I figured out how to pull info on weather from the mlbstats api so I used that data to see which ballparks are the best to go take in a game at. Lots of California teams at the top. *Note: The way I defined good weather doesn't include domes/roofs, which penalizes TB/MIA/HOU/etc.
Tweet media one
Tweet media two
4
4
33
@Drew_Haugen
Drew Haugen
1 year
Breaking balls should be swung at almost everywhere in the zone, whereas hitters should lay off fastballs at the top of the zone and swing more at low fastballs, and vice versa for offspeed pitches. *Swing% OS means Swing% Over what hitters Should.
Tweet media one
@Sky_Kalkman
Sky Kalkman
1 year
@Drew_Haugen From a previous newsletter, this chart showed where hitters (as an MLB aggregate) should swing for a few common (MLB aggregate) pitch types. What I'd love to see is a heat map of the difference between "should swing" and "do swing". (Drew, do you have that?)
Tweet media one
1
0
3
3
6
32
@Drew_Haugen
Drew Haugen
1 year
I've been taking a look at python/pandas recently and have finally started to get a bit more comfortable with data manipulation and aggregation, here's a leaderboard of pitcher pitch type CSW% this season, created in pandas:
Tweet media one
6
3
33
@Drew_Haugen
Drew Haugen
10 months
Interesting idea here, prompted me to look into the correlation between pitch height and launch angle at the hitter level. League wide, the correlation between the two is 0.217. Top and bottom 3 hitter plots along with leaderboards below, full leaderboard in next tweet:
Tweet media one
Tweet media two
Tweet media three
Tweet media four
@levy_cameron
Cameron Levy
10 months
I feel like there is an obvious way to pitch to Juan Soto. Consider his median launch angle on high pitches vs. low pitches. I call it the "hit it where it's pitched" syndrome.
Tweet media one
6
10
54
3
4
32
@Drew_Haugen
Drew Haugen
1 year
Josh Hader's sinker might be my favorite pitch in baseball. It has a 230.1 Stuff+ (my models, highest of any pitch type in MLB) and 122 Pitching+ despite a 93.8 Location+. His stuff is elite and gives him a much higher margin for error than a league average sinker.
Tweet media one
Tweet media two
3
5
32
@Drew_Haugen
Drew Haugen
2 years
The incredible work on what SSW really means by @_kuyamikey led me to investigate how SSW movement really impacts pitch stuff quality. 🧵
Tweet media one
1
4
31
@Drew_Haugen
Drew Haugen
5 months
This question prompted me to investigate how pitcher handedness affects success while controlling for stuff quality. When hitters have the platoon advantage (RHB vs LHP & vice versa), LHP usually outperform RHP with the same quality of stuff.
Tweet media one
@Sky_Kalkman
Sky Kalkman
5 months
Stuff+ question -- is a 100 Stuff+ pitch from a righty just as effective as one from a lefty? Or maybe, does a lefty perhaps outperform a righty with similar Stuff+ ratings? (Due to differences in platoon rates and lower frequency of LHPs overall?)
5
0
1
3
5
30
@Drew_Haugen
Drew Haugen
10 months
Stuff grades are great because they rate just pitch specs, which vary far less than location, but there is a slight relationship between a pitch's stuff and location value. Pitches thrown in optimal locations tend to have better stuff, being well executed pitches overall.
Tweet media one
2
5
29
@Drew_Haugen
Drew Haugen
8 months
The way in which we summarize distributions can hide valuable information. This is often cited in relation to average launch angle, but Michael A. Taylor is a great example of how this concept also applies to exit velocity. A 🧵:
Tweet media one
1
5
28
@Drew_Haugen
Drew Haugen
2 years
A comparison of my Stuff+ grades vs. @enosarris Stuff+ grades is interesting. His models tend to prefer pitchers with higher xCSW%, while my models slightly prefer those with higher xGB%.
Tweet media one
2
1
27
@Drew_Haugen
Drew Haugen
1 year
Lastly, with full pitch quality. The #Dodgers , #Rays and #Yankees led the pack, the #BlueJays had the biggest improvement, and the #Rangers had the most regression.
Tweet media one
@Drew_Haugen
Drew Haugen
1 year
Here's the same viz, but with location quality. The #Dodgers and #Rays have consistently been among the league leaders the past three years, while the #BlueJays improved 19 spots from 2020 and the #Rangers dropped 26 spots.
Tweet media one
2
1
13
2
3
26
@Drew_Haugen
Drew Haugen
1 year
A look into how pitch quality progresses throughout the season. Stuff+ is at it's highest at the beginning of the season, Location+ is pretty steady throughout, and Pitching+ peaks at the end of the season.
Tweet media one
4
5
26
@Drew_Haugen
Drew Haugen
4 months
Here's a look at how team stuff quality progressed over the 2023 season, teams like the #Cardinals and #Twins took a step back at the end of the year while teams like the #WhiteSox and #RedSox actually saw their stuff tick up around September/October.
Tweet media one
2
5
24
@Drew_Haugen
Drew Haugen
1 year
Yordan is a big reason the #Astros are a top 5 hitting team against nasty pitches. The top 5 is made up of the #Rays , the #Yankees , the #Dbacks , the #BlueJays , and the Astros.
Tweet media one
2
6
26
@Drew_Haugen
Drew Haugen
1 year
Justin's comment on Kimbrel's volatility made me curious as to which players have the most consistent pitch quality outing to outing. First, the leaders and laggards in Stuff+ consistency, measured by coefficient of variation:
Tweet media one
Tweet media two
Tweet media three
Tweet media four
@fangraphs
FanGraphs Baseball
1 year
The Phillies Get to Spin the Craig Kimbrel Wheel
0
1
11
1
0
25
@Drew_Haugen
Drew Haugen
2 years
One of the biggest problems with Avg. EV is that it is non-linear with outcomes. As @_Ben_Clemens explained it, "production on contact doesn’t vary linearly with exit velocity, so you end up conflating unlike things". To adjust for this, I created a new stat, EV+. 1/x
Tweet media one
Tweet media two
3
3
24
@Drew_Haugen
Drew Haugen
1 year
Although there isn't a clear pattern at the league level, the residual between inferred axis (from pitch movement) and arm angle (for sinkers) is more meaningful at the player level. Players with an absolute residual >= 28.5 (those highlighted) had an average Stuff+ of 167!!
Tweet media one
@_bawangboy
manny snackquiao 🇵🇭
1 year
@Drew_Haugen @Mind_OverBatter @EliBenPorat would be interested to see arm angle plotted against “observed movement” spin direction (i now call it expected movement direction) i think that’s where you’ll find the interesting stuff. what movement direction you expect based on arm angle versus how the ball actually moves
2
0
1
5
4
23
@Drew_Haugen
Drew Haugen
2 years
Interesting point here by @enosarris . A prime example of this is Yordan Alvarez, who saw the second-largest jump of p(XBH) based on pitch characteristics from '21 to '22 in the league, one of the reasons behind his ISO jump of 68 points. Pitch selection📈 = quality of contact📈
Tweet media one
Tweet media two
@enosarris
Eno Sarris
2 years
Isaac Paredes swings against the fastball with Detroit (left) and with Tampa (right). Power can come from pitch selection too.
Tweet media one
Tweet media two
3
10
78
1
4
22
@Drew_Haugen
Drew Haugen
1 year
tldr: Using pitch quality data, home run probability can be estimated, which lends a better representation of pitcher talent and home run control. Google Sheet with data for all pitchers who threw at least 300 pitches in 2022:
1
1
23
@Drew_Haugen
Drew Haugen
1 year
h/t @Mind_OverBatter @EliBenPorat for their work on arm angles, which are super fun. I wanted to look into the importance of deviating your movement from your slot (arm angles as a proxy for slot) as Robert said. It's pretty important! For FF, vMov residual vs Stuff+ R = 0.5!
Tweet media one
@RobertStock6
Robert Stock
1 year
@enosarris @jokeylocomotive @fangraphs Yea a former organization I played with stressed the importance of having your movement deviate from your arm slot. SSW makes that easy to do.
1
1
9
4
7
23
@Drew_Haugen
Drew Haugen
1 year
I put together a swing decision metric based on the expected run value of a swing vs. a take, and the Mariners had a big improvement this year. Cal Raleigh has the biggest improvement of any hitter in baseball with at least 500 pitches seen in both 2021 and 2022.
Tweet media one
Tweet media two
2
3
22
@Drew_Haugen
Drew Haugen
1 year
Part of what makes splitters fun, outside of their rarity in MLB and insane effectiveness, is, as Nick said, their volatility. In 2022, MLB splitters had a Stuff+ standard deviation of 52.2, while no other pitch type was over 50.
Tweet media one
@PitcherList
Nick Pollack
1 year
@enosarris Soooooo nasty and sooooo volatile.
1
0
4
0
2
22
@Drew_Haugen
Drew Haugen
1 year
#BlueJays 3rd baseman Matt Chapman has been tearing it up in the final year of his contract. He has an insane 67.4 Hard-Hit% this year as well as a launch angle distribution 7% better than league average, which are both big factors in his 100th percentile .473 xwOBA.
Tweet media one
2
3
21
@Drew_Haugen
Drew Haugen
1 year
I wanted to compare how hitter's "preferred" attack angle lines up with their performance on good stuff, elevated four-seam fastballs. For the sample of hitters who have seen at least 65 good elevated FF, there is a decent correlation between attack angle & Whiff% (R = 0.44).
Tweet media one
2
4
21
@Drew_Haugen
Drew Haugen
1 year
I'm currently playing around with hitter comps, here's Oneil Cruz. A pretty interesting mix of hitters.
Tweet media one
6
2
21
@Drew_Haugen
Drew Haugen
1 year
I built an xgboost model to predict launch angle to see how much swing decisions are influencing hitters' launch angles. Walker actually has a an above average expected launch angle based on the pitches he's hit (86th pctl.) but continues to struggle to lift the ball.
Tweet media one
@DolphHauldhagen
Alex "Oxlade" Chamberlain
1 year
re: jordan walker's demotion, his low launch angle, and "working on his swing": (image 1) he likes low pitches (image 2) on average, pitches at the bottom of the zone yield LAs 20°+ flatter than pitches at the top so, did he work on his swing, or did he work on swing decisions?
Tweet media one
Tweet media two
3
5
47
3
4
20
@Drew_Haugen
Drew Haugen
1 year
Within the first week of the season, you have a really good idea of how good a pitcher's fastball is. First week Stuff+ has an R^2 of 0.70 with rest of season Stuff+.
Tweet media one
@Drew_Haugen
Drew Haugen
1 year
Stuff+ is great because it stabilizes super fast, especially for fastballs. Already, among fastballs that were thrown at least 250 times last year and 25 times this year, YOY R^2 = 0.65. This means big changes are meaningful, like Kris Bubic's, who added 75 points of Stuff+!!!
Tweet media one
5
10
69
2
3
20
@Drew_Haugen
Drew Haugen
1 year
-35% swing prob - 58% whiff prob (if swung at) - 52% CSW prob - 4% prob of being put in play - -2.91 xRV/100 - 0.16% (that's 0.00157) prob of being hit for a homer That's the 2nd lowest p(HR) of any pitch actually hit for a homer this year.
@CasasPlsTweet
Eric 🕳️ | 🇳🇱
1 year
@Drew_Haugen can we get the pHR data for this
1
0
3
1
8
19
@Drew_Haugen
Drew Haugen
1 year
Awesome observations here from Lance, here are the most notable of these changes to me: -Ryan SL to ST, Stuff xRV/100 2.2 runs better than SL - Keller SL to CU/ST, takes advantage of supination bias with two distinct breakers, ST Stuff xRV/100 1.4 runs better than SL -Springs📈
Tweet media one
@LanceBroz
Lance Brozdowski
1 year
April 2 pitcher shape metrics of note. #MLB My favorite edition so far. Quick thoughts on Jeffrey Springs, Joe Ryan, Noah Syndergaard, Graham Ashcraft, Tyler Anderson, and Brad Keller.
Tweet media one
9
19
196
0
2
19
@Drew_Haugen
Drew Haugen
1 year
The lowest p(HR) pitch hit for a homer this year? Who else but Shohei Ohtani with a bomb off this Ken Waldichuk sweeper that had just a 0.039% probability of being hit for a homer (10% swing prob, 2% prob of being put in play).
@Drew_Haugen
Drew Haugen
1 year
-35% swing prob - 58% whiff prob (if swung at) - 52% CSW prob - 4% prob of being put in play - -2.91 xRV/100 - 0.16% (that's 0.00157) prob of being hit for a homer That's the 2nd lowest p(HR) of any pitch actually hit for a homer this year.
1
8
19
2
3
18
@Drew_Haugen
Drew Haugen
1 year
An update of Max's viz, for the 2022 season. The #Dodgers and #Rays led baseball with five different pitch types with better than average Stuff+ and Location+, or the top right quadrant of the graph. The #Marlins and #Orioles were just behind at four each.
Tweet media one
@choice_fielder
Max Bay
3 years
I need to add transparency to the logos but here you go!
Tweet media one
3
2
15
0
3
18
@Drew_Haugen
Drew Haugen
3 months
#Brewers pitcher Bryse WIlson has improved his command significantly this season. His Location+ per FG/ @enosarris has jumped from exactly average in 2023 to 108 in 2024. He is elevating his 4-Seam very well, burying his curveball down, and getting his sinker down and in to RHB.
0
4
17
@Drew_Haugen
Drew Haugen
1 year
@_kuyamikey Mine does🙋‍♂️
Tweet media one
2
1
17
@Drew_Haugen
Drew Haugen
1 year
Brock Stewart's fastball is more impressive the more you look into it. It gets whiffs at the highest rate of any pitch (relative to its pitch type), and gets called strikes at an above average rate. Pitch types with >= 175 SwStr+ and 115 Called Strike+: Stewart FF and Snell CH
Tweet media one
Tweet media two
Tweet media three
@Drew_Haugen
Drew Haugen
1 year
I've been taking a look at python/pandas recently and have finally started to get a bit more comfortable with data manipulation and aggregation, here's a leaderboard of pitcher pitch type CSW% this season, created in pandas:
Tweet media one
6
3
33
2
2
17
@Drew_Haugen
Drew Haugen
1 year
I've been playing around with the mlbplotR package lately, which is a super cool tool from @k_camden . Here is Stuff+ above average by team and pitch movement for one of my favorite pitchers, Matt Brash, with his headshot. Can't wait to use this package more! #rstats
Tweet media one
Tweet media two
2
4
17
@Drew_Haugen
Drew Haugen
1 year
I took a look into some hitting metrics for the great American states 🇺🇸. New Jersey (Mike Trout's home state) leads all states in xwOBACON, Delaware (Paul Goldschmidt's home state) leads in avg. exit velo, and Minnesota leads in SwStr%.
Tweet media one
Tweet media two
Tweet media three
1
2
17
@Drew_Haugen
Drew Haugen
9 months
Pitch modeling is huge for talent evaluation, get a look into some prospect pitch quality (Stuff+/Location+/Pitching+) with some graphs, tables, and a full leaderboard in the article below!
@downonthefarm12
Down on the Farm
9 months
Building pitching models at the Minor League Level, @Drew_Haugen takes a look at Triple-A pitch quality at both the player and team level 🔥⬇️
Tweet media one
3
15
26
1
3
16
@Drew_Haugen
Drew Haugen
5 months
Kyle does some of the best work on this app and is super great about offering advice/sharing code, notebooks like these are a fantastic resource for anyone interested in data manipulation + visualization in python.
@blandalytics
Kyle Bland
5 months
Code can be found here:
1
1
16
1
2
15
@Drew_Haugen
Drew Haugen
1 year
Splitters also have the most volatile location quality of any pitch type. The unique grip and release of a splitter is what makes the pitch so effective, but that grip/release also makes it difficult to create a consistent movement profile and have consistent command.
Tweet media one
@Drew_Haugen
Drew Haugen
1 year
Part of what makes splitters fun, outside of their rarity in MLB and insane effectiveness, is, as Nick said, their volatility. In 2022, MLB splitters had a Stuff+ standard deviation of 52.2, while no other pitch type was over 50.
Tweet media one
0
2
22
1
4
15
@Drew_Haugen
Drew Haugen
1 year
All of the worst xRV pitches are high HBP prob pitches, so these are the 5 worst xRV pitches with a swing prob > 50%. These pitches had an avg. EV of 102 and .615 xwOBA, but just a .250 wOBA. Even on the worst pitches, pitchers often still come out on top.
@Sky_Kalkman
Sky Kalkman
1 year
@Drew_Haugen Would be cool to see the worst pitches of the day, and what the hitters did with them. Who took advantage and who did not.
1
0
1
1
2
16
@Drew_Haugen
Drew Haugen
1 year
Pitching+ is relative to each pitch type, so teams that throw more low xRV pitch types have better xRVs than their Pitching+ would suggest. Teams like the #Yankees and #Astros beat their relative pitch quality by throwing fewer fastballs. Very American. @mason_mcrae
Tweet media one
Tweet media two
2
2
15
@Drew_Haugen
Drew Haugen
11 months
Interesting note here from @drivelinekyle , because it's something that might not seem intuitive. Here's what the data shows, with Fujinami highlighted:
Tweet media one
@drivelinekyle
Kyle Boddy
11 months
Notice that Fujinami threw more strikes as his velocity sat 100-101. Taking something off your fastball changes your mechanics to an unfamiliar pattern. Why would that lead to better control? Operate at the same effort you train at to get the best results. Change focal points.
3
30
250
2
4
15
@Drew_Haugen
Drew Haugen
1 year
Hunter Gaddis has some good breaking stuff and a great changeup, as well as really solid command, but his fastball stuff quality is pretty poor. However, if he can maintain the command of the fastball he's had so far it can still be a good pitch.
Tweet media one
Tweet media two
@GovofGivener
GovenorofGivener
1 year
@Drew_Haugen Interested how Gaddis stuff+ pitching+ is after 2 starts?
0
0
1
2
2
15
@Drew_Haugen
Drew Haugen
1 year
Thanks for the shout out @BenLindbergh and @megrowler ! The #Dodgers had the best plate discipline in baseball by a good margin, a big reason, as stated in the podcast, they led baseball in offensive production. Check out their great discussion of plate discipline/swinging less⬇️!
Tweet media one
Tweet media two
Tweet media three
@EWPod
Effectively Wild Pod
1 year
On our latest episode: Pitchers are calling their own pitches, hitters are seemingly swinging too much, @FabianArdaya previews the Dodgers, @sahadevsharma previews the Cubs, and we remember when the White Sox wore shorts.
1
3
6
2
5
14
@Drew_Haugen
Drew Haugen
6 months
One of my findings in this article is that although exit velocity is higher to the pull side, launch angle tends to decrease significantly. Take a look at the full article to see more!
Tweet media one
@downonthefarm12
Down on the Farm
6 months
Latest Down on the Farm article is out! @Drew_Haugen explores batted-ball spray angle and how it can inform a player's approach at the plate. Free and unlocked for everyone to read! 🔥⬇️
Tweet media one
1
11
16
1
4
11
@Drew_Haugen
Drew Haugen
2 years
@BaseballBros In the 870 possible games played since Corey Seager's first full season, he has played in 636. How can that be compared to the record holder for most consecutive games played?
2
0
14
@Drew_Haugen
Drew Haugen
2 years
Matt Brash's plot is a stark comparison, far more blue than deGrom. SL Stuff is obviously amazing but definitely not optimized for chases due to break differences. Hammers home the point made by @Tieran711 , @MaxwellResnick , @ydouright , @WillSugeStats , @eli2722 , and others.
Tweet media one
@Drew_Haugen
Drew Haugen
2 years
Put together a little viz to show the effect of stuff on chases. It compares swing prob from the SL location only model to swing prob with location + deGrom SL stuff characteristics. Stuff induces ~8% more swings off the outside corner, but loses ~15% under the zone.
Tweet media one
0
0
7
1
1
13
@Drew_Haugen
Drew Haugen
1 year
The #Orioles ’ Gunnar Henderson has all the tools, but if he can't fix his GB problems, it's going to be difficult for him to truly be a star. He profiles similarly to Christian Yelich and Tommy Pham, two other hitters also held back by their launch angle distribution.
Tweet media one
4
2
14
@Drew_Haugen
Drew Haugen
1 year
Here's the same viz, but with location quality. The #Dodgers and #Rays have consistently been among the league leaders the past three years, while the #BlueJays improved 19 spots from 2020 and the #Rangers dropped 26 spots.
Tweet media one
@Drew_Haugen
Drew Haugen
1 year
A look into how pitching staffs have developed, in terms of stuff quality, from 2020 to 2022. The #Yankees have led the league in Stuff+ the past two seasons, while the #RedSox saw the biggest jump in the league from '20 to '22, and the #Dbacks saw the biggest drop-off.
Tweet media one
9
19
63
2
1
13
@Drew_Haugen
Drew Haugen
2 months
I was curious so I put together a viz of the leaders in sum IVB in 2023. Last year, Spencer Strider's fastballs had a total of 2789 feet of ride, or 7.75 football fields. Tyler Rogers' rising slider stands out and leads all sliders despite being thrown far less than the others.
Tweet media one
1
2
13
@Drew_Haugen
Drew Haugen
1 year
@CardinalsReek Nice. I created a stat called LA+ (launch angle+) that was essentially a rescaled xwOBACON with launch angle as the only input to quantify exactly how valuable a hitter’s launch angle distribution was, and unsurprisingly Arraez led the league by far.
1
0
12
@Drew_Haugen
Drew Haugen
5 months
I used this same game info, which also contains the game umpires, to analyze different home plate umpire tendencies. Guys like Angel Hernandez and Vic Carapazza are trigger-happy on the edges of the zone, while guys like Dan Bellino and Edwin Moscoso are more conservative.
Tweet media one
@Drew_Haugen
Drew Haugen
5 months
I figured out how to pull info on weather from the mlbstats api so I used that data to see which ballparks are the best to go take in a game at. Lots of California teams at the top. *Note: The way I defined good weather doesn't include domes/roofs, which penalizes TB/MIA/HOU/etc.
Tweet media one
Tweet media two
4
4
33
6
2
11
@Drew_Haugen
Drew Haugen
1 year
I wanted to investigate this relationship with my swing decision metric, and although not a super strong relationship, there definitely is a connection between discipline and power production.
Tweet media one
@enosarris
Eno Sarris
1 year
@DolphHauldhagen @NotTheBobbyOrr yes exactly, the heat map of the strike zone still shows barrels in the middle, so discipline has to be good. confounding to me, though, that I'm looking at 1900 player seasons in Statcast era with a .07 r2 between z-o swing and barrel rate.
4
0
3
2
0
11
@Drew_Haugen
Drew Haugen
1 year
Here's the same data, but broken out by pitch group. Secondary pitches from slow working pitcher have suffered the most, especially curveballs and changeups. This could be based on the amount of effort different pitch types require, but that's just a theory.
Tweet media one
Tweet media two
@Drew_Haugen
Drew Haugen
1 year
Good point here from Anthony, in terms of decrease in Stuff+, the bottom quartile of pitchers in tempo from 2022 have been hurt the most, very likely due to the new pitch clock. Interestingly, there is a non-negligible relationship between pitcher tempo and stuff quality.
Tweet media one
Tweet media two
5
15
63
1
2
12
@Drew_Haugen
Drew Haugen
2 years
The best single-game framing performance of 2021, by far, goes to @HipHipJose5 on April 27th. Added over 13 more strikes per 100 takes than expected and in total was worth 1.29 runs in just 72 takes. 1/2
@Drew_Haugen
Drew Haugen
2 years
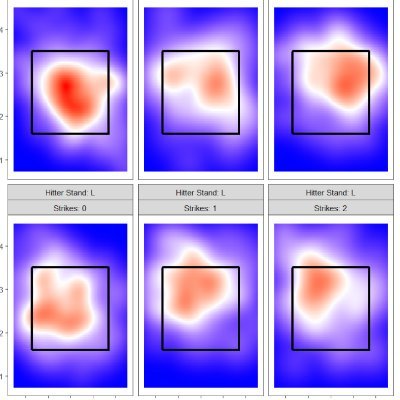
Recently been looking at strike probability using a GAM for framing, pitcher command, and a couple other things. Below is the changing called strike probability of pitch based on batter handedness. The only variables are horizontal and vertical plate coordinates.
0
0
2
1
3
11
@Drew_Haugen
Drew Haugen
2 years
Here is the full leaderboard, along with Stuff+, Location+, Pitching+, and xRV/100 stats from the 2022 season (min. 500 pitches):
@Drew_Haugen
Drew Haugen
2 years
This awesome thread inspired me to create a new stat, Wiggle Room+: the amount of area in inches a certain pitcher pitch type can be thrown to and expect good results (a negative xRV), compared to the average for that pitch type. In other words, the blue area on a heat map. 🧵
Tweet media one
Tweet media two
2
1
50
1
4
12
@Drew_Haugen
Drew Haugen
1 year
Ken Waldichuk is legit. He put up a 110 Stuff+ or higher on four pitches and has a legit whiff offering in the sweeping slider, comps include Sale SL, Berríos CU, Manoah SL, Ottavino SL, and E Phillips SL.
Tweet media one
Tweet media two
Tweet media three
@enosarris
Eno Sarris
1 year
ten deep league starting pitcher sleepers
2
3
49
1
1
12
@Drew_Haugen
Drew Haugen
1 year
#Reds reliever Alexis Díaz doesn't get talked about enough. He releases his fastball from the same height as his brother, Edwin Díaz, (one of his closest comps) which Stuff+ loves (159.5, 1.4 points higher than Edwin) and pairs it with a great slider (140 Stuff+).
Tweet media one
Tweet media two
Tweet media three
0
0
12
@Drew_Haugen
Drew Haugen
1 year
The relationship between arm angle and inferred spin axis is, in general, stronger for four-seamers than sinkers, but cutter-like four-seamers such as Keller's, Steele's, Bradish's, and Suter's are big outliers.
Tweet media one
@_bawangboy
manny snackquiao 🇵🇭
1 year
@Drew_Haugen this is fascinating stuff. i imagine it’s a more meaningful relationship for fours
0
0
1
1
5
11
@Drew_Haugen
Drew Haugen
1 year
Jump in Stuff+ ranking from 2020 to 2022 and jump in run prevention ranking moderately correlate, with Stuff+ jump vs. FIP jump showing a slightly stronger relationship than Stuff+ jump vs. xFIP jump.
Tweet media one
Tweet media two
Tweet media three
Tweet media four
@RobertStock6
Robert Stock
1 year
@Drew_Haugen How did their runs allowed relate to stuff+ improvement?
0
0
2
2
2
11
@Drew_Haugen
Drew Haugen
8 months
@levy_cameron cc: @levy_cameron @enosarris @srbrown70 @DolphHauldhagen @RylanDomingues Here is some more data, with IVB Over Expected which normalizes ride based on release point. IVB Over Expected suggests that hitters are improving slightly against ride compared to 2020-21.
Tweet media one
Tweet media two
Tweet media three
Tweet media four
3
1
10
@Drew_Haugen
Drew Haugen
2 years
There is a strong relationship between average estimated bat speed and average exit velocity (R =.85, R^2 =.73). However, certain players overperform/underperform expected EV due to EA, aka collision efficiency.
Tweet media one
3
0
10
@Drew_Haugen
Drew Haugen
1 year
@RyanGarciaESM My models like his stuff🤷‍♂️
Tweet media one
Tweet media two
Tweet media three
6
0
10
@Drew_Haugen
Drew Haugen
1 year
Big things could be on the horizon for the #BlueJays Yusei Kikuchi if he can just get his fastball command close to league average. Great 127 Stuff+, not so great 88.4 Location+. Finding a way to elevate and get out of the heart of the zone would be huge for him.
Tweet media one
Tweet media two
@Drew_Haugen
Drew Haugen
1 year
Here's a comparison of where Bundy throws his fastball vs. where he should. He locates up and away to lefties often but the model prefers the FF up and in, and he locates in-zone in 2k counts far more than he should, as the IVB leads to positive expected results above the zone.
Tweet media one
Tweet media two
1
2
8
1
1
9
@Drew_Haugen
Drew Haugen
1 year
Was interested when I looked into Cleavinger and saw that he had a poor SL Stuff+ from my models, but he really turned it on at the end of the season. Took his slider from more of a slurve to a true sweeper and saw all his pitches improve with a lower release point.
Tweet media one
Tweet media two
Tweet media three
@rekrabmb
Michael Barker🦘
1 year
Top 5 RP in the new @PitcherList PLA QP% (Quality Pitch%, PLV >=5.5), min. 300 pitches: 1. Fairbanks (62.8%)👀 2. Clase (62.1%) 3. Munoz (57.6%) 4. GARRETT CLEAVINGER (56.5%) 5. Diaz (56.3%) Cleavinger flashed 3 elite pitches in 2022, with a top-10 LH SL by PLV. Don't sleep.
Tweet media one
4
7
54
1
1
10
@Drew_Haugen
Drew Haugen
1 year
The #Royals are going to be a ton of fun in 2023. Many of their rookies showed flashes last season and are primed to put it together next season. @VPasquantino has an especially impressive profile, look at all that red!
Tweet media one
1
0
10
@Drew_Haugen
Drew Haugen
2 years
Excited to showcase my recently finished pitch quality models, especially Stuff+, on @MSportingStudio ! I focused more on model results and what Stuff+ likes, so feel free to dm me with any questions on my process/methodology!
@MSportingStudio
Max’s Sporting Studio
2 years
New post: Introducing Stuff+, Location+, and Pitching+ Drew Haugen
0
1
6
1
1
9
@Drew_Haugen
Drew Haugen
1 year
p(HR) is the probability a pitch is hit for a home run based on its stuff characteristics and location, along with count, batter hand, and pitcher hand. For example, the following pitch had the highest probability of being hit for a HR of any pitch last year at 7.8%:
3
1
9
@Drew_Haugen
Drew Haugen
5 months
Check it out and let me know what y’all think, in this article I introduce a few metrics for evaluating launch angle that are more insightful than current options like Avg. LA, Median LA, and even Sweet-Spot%.
@downonthefarm12
Down on the Farm
5 months
What makes a launch angle good? Contextualizing batted-ball profiles by understanding the relationship between batter launch angle and exit velocity 🔥⚾️⬇️ @Drew_Haugen
Tweet media one
2
8
17
0
3
9
@Drew_Haugen
Drew Haugen
1 year
p(HR) is valuable because, as it only looks at pitch properties, factors like batter skill, weather or wind, and ballpark dimensions are ignored. Because of this, pitcher xHR (expected home run, or the mean of p(HR)) rate was far more stable year over year than observed HR rate.
Tweet media one
Tweet media two
1
1
9
@Drew_Haugen
Drew Haugen
1 year
Corey Seager is going to turn it around for the #Rangers in 2023. Although not bad in 2022, he had an xwOBA 41 points lower than his real wOBA. Additionally, his 15 best comps had an average wOBA 20 points higher. Especially with shift restrictions, a 145 wRC+ isn't unreasonable.
Tweet media one
1
1
9
@Drew_Haugen
Drew Haugen
1 year
On the flip side, this towering shot from Jean Segura had the lowest p(HR) of any pitch hit for a homer last year at 0.00384%, in part due to its swing probability of 28% and just 10% probability of making contact, given a swing:
2
1
8
@Drew_Haugen
Drew Haugen
5 months
Here's a graphical look at BYU's crazy game last night against UCF: @gregwrubell @BYUstatsMAN @GrantNielson2 #GoCougs
Tweet media one
@gregwrubell
Greg Wrubell
5 months
13% of last night's total points were scored in the final 2.5% of the game.
1
0
42
1
2
7
@Drew_Haugen
Drew Haugen
1 year
Here's a comparison of where Bundy throws his fastball vs. where he should. He locates up and away to lefties often but the model prefers the FF up and in, and he locates in-zone in 2k counts far more than he should, as the IVB leads to positive expected results above the zone.
Tweet media one
Tweet media two
@AlexFast8
Alex Fast
1 year
Dylan Bundy had a top 10 IVB on his four-seamer last year yet elevated below a league average amount. I wonder would happen if he sat at the top of the zone more. If he could do that + find a way to get back to sitting 91, i think he could have a very good FF/SL combo
8
0
10
1
2
8
@Drew_Haugen
Drew Haugen
2 years
Shohei Ohtani is absolutely alien. He is one of only two pitchers in MLB with six pitches above average by my Stuff+ models (Darvish is other), with his "worst" pitch, his curveball, still an impressive 120. His new sinker is the 5th best SI by Stuff+ in the league already!
@CodifyBaseball
Codify
2 years
The Shohei Ohtani Two-Seamer! 🔥🔥🔥 This one was 97 with a full 17" of horizontal! 😍 Imagine having this as your SIXTH pitch. 🤯 cc: @PitchingNinja
1
58
564
0
1
8