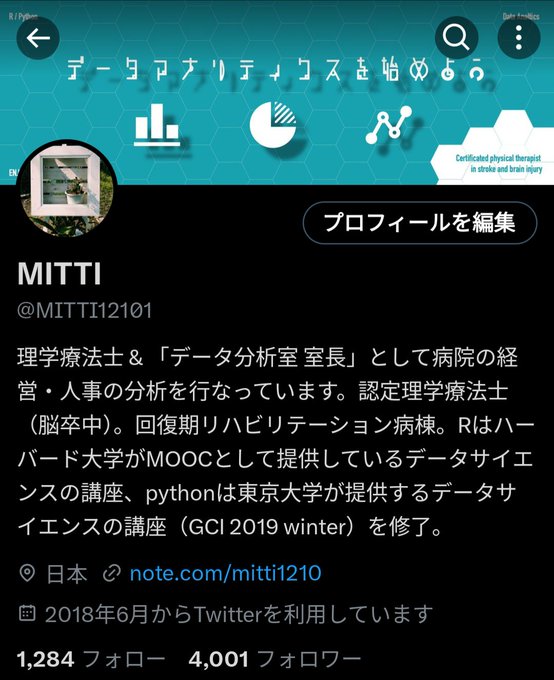
MITTI
@MITTI12101
4,633
Followers
1,460
Following
917
Media
18,134
Statuses
理学療法士 & 「データ分析室 室長」として病院の経営・人事の分析を行なっています。認定理学療法士(脳卒中)。回復期リハビリテーション病棟。Rはハーバード大学がMOOCとして提供しているデータサイエンスの講座、pythonは東京大学が提供するデータサイエンスの講座(GCI 2019 winter)を修了。
Don't wanna be here?
Send us removal request.