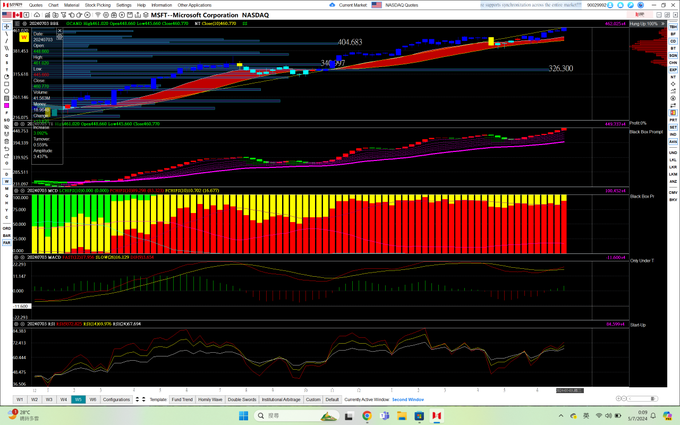
Tsla, pltr and nvdia investor. I use my homily charts for investing. Not financial advice. Tesla car owner, piano self learner. Don’t follow me as I’m stupid.
How to read my charts more accurately?
Box 1/Panel 1: Candle patterns
1. Red candle----a bullish signal, hinting that there is an uptrend in the shorter term.
2. Yellow candle---a bearish signal, implying that there is a downtrend in a shorter term.
3. Dark blue
I gave you the red candle (bullish call) for $NVDA between $103-$106 on 9 August.
I gave you the red candle (bullish call) for $PLTR at $21.5 on 3 May, $25.5 on 6 August.
I gave you the red candle (bullish call) for $TSM between $148 and $157 on 6 August.
I gave you the red
I sent you the red candles (bullish signals) for $NVDA and $SMCI when they were around $45 and $320 back in January, and subsequently $CVNA at around $48, $PLTR between $18 and $20, $MSTR at around $620, $AAPL at $180, $AMZN at $180, and the last red candle for $TSLA was sent
I’m still compiling a list of stocks with RED CANDLES (bullish calls) or other bullish signals and would post it tomorrow evening or Monday morning (Hong Kong time). My time and efforts are worthwhile if most of you appreciate my work.
In the past three years, I made several successful investment decisions:
1. I sold my $TSLA shares at $270 and $310 at a loss of US$4 million in 2022 after conducting technical analysis and predicting a decline.
2. I sold all my $BABA shares at a small loss, when they were
The power of whale accumulation (adapted from my patreon on 21 July 2024)
Initially, I was heavily invested in $NVDA and $PLTR because they both align with the narrative of the AI cycle, which is the main theme driving this bullish market. My accumulation period usually lasts
The market has offered numerous opportunities to buy or accumulate, and my charts have sent out a lot of red candles (bullish signals/buy signals) in these stocks that were still relatively cheap:
$NVDA below $45
$SMCI below $300
$MSTR below $550
$AVGO below $1120
$TSLA below
Are you interested in how I recovered from losses of more than US$ 4 million and continue to make gains of millions, even though I shared this earlier in Jan and Feb?
Do you guys want to me share how I use Bollinger bands to spot the right stocks for the upcoming surge?
At my chatroom, I was using crocodile's mouth to spot that buying signal. If I have more followers and more likes, I will share with you. The success rate is almost above
I'm planning to soon introduce another reliable indicator to more accurately predict trend reversals in both downtrends and uptrends, complementing the use of both red and yellow candle signals for increased accuracy. A 94% accuracy rate isn't good enough for me. To outperform
Three years ago, I was convinced of my own investment strategy, nearly going all in on TSLA, which ultimately led to a $4 million loss.
At the time, I also suffered from CHOPINPHOBIA, as the complexity of Chopin's compositions overwhelmed me. I never thought I would be able to
I understand that some might be curious as to why I haven't sold my long-term investments, especially considering that many of you have seen returns of 5X to 8X over the past year. I am sure that if you were in my position, you would also be eager to take profits.
However, I
I called $NVDA a buy when I first tweeted about it at $450 in early January and set my target price at $973, then raised it to $1120 on March 1 on my Patreon.
I called $AMD a buy when it was bottoming between $142-$145, forming a double bottom with an inverse head and shoulder
How to read my charts in more detail?
1. Red candle —buy
2. Yellow candle —sell
3. Whales (red bars in the 3rd box) need to reach 50 %for the stock to run and 75 % to surge
Whales can both accumulate and distribute.
The longer the red bars, the more whales—a bullish trend
The
Follow me if u like to make $, as I share my TA with charts and how I recovered from my 4-million losses and have made gains over the past year. Unfollow me if $ is your enemy.
Trend is always our best friend in both bullish and bearish cycles. I trade or invest based on the trends created by whales, not those that retail investors believe in. It took me years to learn this lesson, and I am happy to share it with all of you.
Are you among the retail investors anticipating the following scenarios?
1. $NVDA (NVIDIA) dropping to the $70 to $90 range
2. $PLTR (Palantir Technologies) retreating to $25 or $27, especially if you've sold between $32 and $34
3. $TSLA (Tesla) returning to the $200 mark
4.
The more I check the charts, the more red candles I discover. Initially, I planned to go out for lunch, but I've chosen to stay home and continue analyzing because I'm committed to providing the most accurate and timely insights for my followers. Please stay tuned!
I recently had lunch with some influential individuals in Hong Kong, and they informed me that the Hong Kong government is employing Palantir's technology. I won't sell the hen that lays the golden eggs.
$PLTR
Insider buying by Peter Thiel, who increased his stake in $PLTR from 7% of the company to more than 10% of the company in the latest filing gave us a shot in the arm.
I often struggle to understand human mentality. When I share bullish stocks, people seem to think I'm encouraging them to buy, and when I post bearish stocks, they believe I'm mocking them. It's disheartening to spend hours meticulously preparing my charts to share a list of
I canceled my lunch outing. Instead, I decided to order from Deliveroo because the red candles (bullish signals) have got me excited. Please stay tuned.
I am not, and will never be the best. However, I am always trying my best. I will never give you any financial advice, but I share bullish and bearish market signals as soon as I spot them. I suppose I'm one of the very few who enjoy charting 10 hours a day, sharing and working
We don't need a lot of stocks to succeed in our lives. Some people make their first capital at Tesla (TSLA), while I made mine with NVIDIA (NVDA), which brought me 8X returns. When planning a portfolio, we need to be diversified and handpick stocks that align with the narratives
My Top 5 positions in the portfolio:
Many guys are interested in how I placed my bets:
I am sharing with you guys my top 5 positions in order:
1. NVDA
2. PLTR
3. AMD
4. MARA
5. MSTR
What a gambler I am.
Back to 2021, I was all in in TSLA, like many guys and Youtubers who
My sharing of cut-loss experience in TSLA in 2022
Very often I get asked if they should sell TSLA now and buy stocks which have better momentum.
To be honest I don't have any clues. Nor do I have the crystal ball to predict the future actions. This is completely contradictory
$TSLA (14 August 2024-daily chart review)
TSLA has shown promising signs of bottoming out:
Panel 1: Daily Candles
Since hitting a recent low of $182 on August 5th, TSLA's daily candles have been forming higher highs. The last candle touched the lower boundary of the blue
Would you be interested if I enhanced my analysis with a more detailed numerical approach? Adding another indicator and deeper calculations would mean dedicating an extra 10 minutes per stock. This might reduce my daily analysis from 55-60 to 40-45 stocks. What are your thoughts
How to read my charts effectively? (an updated version)
Box 1/Panel 1: Candle patterns
1. Red candle----a bullish signal, hinting that there is an uptrend in a shorter term.
2. Yellow candle---a bearish signal, implying that there is a downtrend in a shorter term.
3. Dark
Sometimes, it is funny to note that when I post bearish trends about ( $TSLA, $CRWD, $CLSK), people like to unfollow me. But it is fine if $ is your enemy.
$NVDA (3 July 2024-daily review from my Patreon)
NVDA has been pulling back after hitting resistance at $140. Historically, it takes 6-10 days to see another bullish signal (red candle). The current support levels are $117.8 and $120.5 $123.5 and $125.8. A daily close above
I’m super happy not because I make $ but because I have received so many tweets telling me how much gains you have made over the past few weeks in stocks, calls and even puts.
Remember that I have put in a lot of hard work and time behind my tweets. I look at my charts,
I'm currently compiling a list of stocks that are showing bullish signals. Here's what you will see in my updated post later on my patreon, hopefully before 10am (in Hong Kong's time) on 19 August 2024
1. Why It's Bullish: Each stock will come with a specific indicator
I'm still busy compiling a list of stocks with bullish signals. This is the first time I've spent more than 3 hours compiling, writing, and grouping them into two posts. Typically, one post is usually sufficient.
On a red day, let me share with you 4 interesting people that I have encountered from my daily charting.
1. A guy who insists on me finding the exact bottom price of stocks in my system.
2. A guy who asked me to just handpick a sure-win stock.
These 2 questions are worth more
From September 1st, I will be adjusting the monthly fee for my Patreon due to the increased time and effort I dedicate to it. I now spend over 11 hours daily charting,observing the trends, analyzing more than 50 tickers, and responding to questions. Despite the market holidays, I
Winning once by going all-in on $TSLA might be attributed to luck, but achieving success twice—selling Tesla at its peak and then fully investing in $PLTR, accumulating from $6 to $15 in 2022—that's not sheer luck; it's strategic acumen that outshines most Wall Street fund
Many people wonder why I continue to strive and push my limits, especially when financial security is not a concern for me. They often ask why I persist in investing and working hard when I could easily choose a path of comfortable leisure. My answer lies in my personal
$PLTR (18 June 2024-daily)
Whales on the daily chart have been playing tricks on us for a long time, but based on my experience and observation, I have been tracking them on the weekly chart because, first of all, I am not a trader but an investor. I focus on a big picture
$TSLA (14 June 2024-daily)
Following the finalization of Elon Musk's compensation package, TSLA gained some momentum and broke above a crucial resistance level at $181. The stock opened high and climbed to $191, but lost some steam towards the end of the trading session,
How to read my charts? (An updated version)
Box 1/Panel 1: Candle patterns
1. Red candle----a bullish signal, hinting that there is an upward trend
2. Yellow candle---a bearish signal, implying that there is a downward trend.
3. Dark blue candle--the bullish trend persists
Anybody interested in red candles (bullish calls)? My weekend post (14 July ) and yesterday's post highlighted those stocks with red candle signals, such as miners, Fin-techs and a list of hot stocks. When I finish my regular review, I might share some on X. Please stay tuned.
Sometimes I don’t understand why people like to complain that I post too many charts. The more I post, the better our skills are in picking the right stocks.
There is always no short cut to learning in our journey of investment. I appreciate every dip, every chance of learning
$TSLA
Funds kept pouring it. (The data has been updated till 30 June 2024). The list still goes on and on. The last time I shared the funds accumulating PLTR was when it was $22.5-$23.
When I sent out bullish signals (red candles) for PLTR between $21 and $22, TSLA below $180, NVDA between $80 and $85, and AMD between $156 and $164 on Patreon, some didn't follow but just kept asking me if it was too late to buy now.
This has happened many times before,
I'm often puzzled by why people expect me to predict the exact bottom of stock prices. My analysis, covering over 50 stocks, is priced at a modest $10-15 monthly subscription. Even during my tenure at private banks, wealthy clients never relied on me to pinpoint market lows.
Kung Hei Fat Choy
Today is the Chinese Lunar New Year. I wish everyone all the best in the year of the Dragon.
My chart sharing routine goes on as usual. I start with daily chart review, followed by weekly ones later. Stay tuned.
$PLTR (10 July 2024-daily analysis)
My red candle signals were sent out twice when PLTR was trading between $21 and $21.96 on May 30th and between $25 and $25.57 on June 28th. The market consistently provided opportunities; it is up to us to seize them.
I even shared my
$CLSK (9 Feb 2024)
As mentioned a few times, CLSK has the best charts on a daily, weekly and monthly basis. If you guys read between the lines, you will be rewarded with a big "red packet" by whales to celebrate the Year of the Dragon in just 2 days.
Luckily I bought CLSK
During my charting and analysis this week, I noticed a significant number of red candles. I'll be posting them on my Patreon first and sharing some on X, if you're interested. Please note that this is not financial advice.
Sometimes, I find it challenging to understand human psychology. When I post charts, I notice a decrease in followers. When I share charts of China stocks indicating a shift from bearish to bullish, some people unfollow me. When I post charts that I believe are bullish, others
I was once so naive and stupid, believing in so many YouTubers and so-called analysts.
Of course I cut loss, paid for my painful lessons but still I moved on, learned from my mistakes, studied even harder, picked up a variety of TA and learned to use my system.
Guys, I am
You guys are amazing. You read my mind easily. I was tweeting yesterday that I planned to buy 5 stocks. But I ended up buying 7. Most guys thought I would buy PLTR and NVDA but I didn't.
Here is the list and all were purchased at the market open last night:
1 MARA x 5000
Over the weekend, I analyzed 57 stocks using my simple technical analysis (TA). I showed over 109 charts, including daily and weekly charts. If time permits, I may show additional charts or discuss my TA further.
Currently, I am compiling a list of stocks with bullish signals.
$TSLA (daily chart, March)
A red ribbon, with reduced retail accumulation to 49.812%. This is usually the sign of bottoming out. The red ribbon can unfold, with more whales coming in. If TSLA can close over $207, the next target is $218-220.
$CLSK (19 May 2024-daily vs weekly)
CLSK has been trading sideways between $15 and $17.5, as mentioned numerous times. This sideways movement can last anywhere from 4-6 weeks to 3 months. During this period, whales may be buying, selling, shaking out retail investors, and
$CLSK (9 March 2024, daily)
The daily chart is the best among all miners:
1. strong whale accumulation of over 93.8%
2. no green bar (retail accumulation), bullish sign
3. a massive inflow of capital yesterday
4. MACD: a new golden cross is to be formed (hopefully)
5. RSI
$TSLA (23 June 2024-daily vs weekly)
Tesla appears to be bottoming out, with confirmation of red candles on both daily and weekly charts, although the process is not yet complete on the weekly chart. The strong support level at $181.5 must hold for Tesla to regain momentum. A
$TSLA (31 March 2024-monthly review)
Panel 1: Ribbons, Candles, Duration
Since November 30, 2022, TSLA has been experiencing a persistent downward trend indicated by the blue ribbon. Previously, TSLA had a 9-month downward trend from March 29, 2019, to December 31, 2019,
$TSLA (13 June 2024-daily analysis)
The long-awaited red candle appeared last night, bringing joy to many investors before Elon's compensation package was finalized. For the bullish trend to play out successfully, a daily close above $180.55 is required, while a close below
This week's bullish list is quite long, perhaps the longest I have seen since setting up my Patreon in mid-February. It takes time, patience, and energy to find those bullish stocks. I am still compiling the list and will send it out to my followers on Patreon hopefully on Sunday
$NVDA (18 August 2024-daily)
I'm often asked about the best time to buy $NVDA and whether it's possible to time the lowest entry point for a stock. My response is that this is a multi-million dollar question, far beyond the scope of my monthly fee of $10-$15 on patreon. Even
To be good isn't good enough. We all need to outpeform and excel. Hopefully from next month onwards, I am going to introduce one more reliable indicator on my patreon to improve or reinforce my accuracy. I will NOT share this on X, in case people try to duplicate it. But anyway,
$PLTR (27 August 2024-daily)
PLTR's Market Performance
PLTR closed with a yellow candle, indicating a bearish signal.
Conditions for Trend Reversal
To resume the uptrend, a daily close above $31.74 is necessary. Conversely, closing below $30.79 would trigger a downtrend.
From May to early July 2024, I have been sharing red candles (bullish signals/buy signals) for various stocks with my Patreon members. These signals were sent out for $PLTR when it was trading between $20.5 and $21.5, $TSLA when it was below $180, $EOSE when it was below $0.9,
$MSFT (5 July 2024-weekly chart analysis)
How to identify buy signals? (for new followers)
To identify buy signals from your charts, let's analyze the weekly chart of MSFT with five panels:
1. Follow the red candles in Panel 1:
Three red candles have appeared on the chart.
$CLSK (23 Feb 2024)
As mentioned before, CLSK has the best technical trends on daily, weekly and monthly charts. Many guys have a misconception that buying a laggard is a good strategy in a bullish run.
On the contrary, I love to buy stocks which show the strongest momentum.
My sharing of how I constantly build up my positions in my portfolio
1. Strategic Timing Over Bottom Fishing:
Avoid Timing the Bottom: Unlike many retail investors, I don't aim to catch stocks at their absolute lows. Instead, I wait for whales to lay down strong foundations and
This weekend, I'll be posting daily, weekly, and monthly charts for over 55 stocks, complete with my own technical analysis on my patreon. Please stay tuned.
Guys, I just realize that a lot of guys have sour grapes when they see stocks soar in the semi-conductor fields while their stocks move sideways or keep plunging.
In the same vein, most just regret having invested in Tsla and some analysts keep downgrading tsla to $150 or even
If you guys read between the lines, you can guess what I was accumulating at market open. I was tweeting MSTR the whole day. Most are miner stocks and one Bitcoin-related stock:
1. CLSK at $14.18 x 2000
2 Mara at $23.62 x5000
3. Riot at $14.58 x 3000
4. Wulf at 2.22 x 3000
5.
$PLTR (Weekly review 11 Feb )
Will it be another NVDA?
I didn't know what PLTR was until I came across a lady
@sheslee
in April 2023. She is one of my good friends and sisters who kept motivating me and shared her painful yet inspiring story of PLTR accumulation from 2022-2023.
A sharing of my simple strategies (27 July 2024)
I've shared my story of transforming from a big loser to a humble winner on X several times before, in January and February. Since then, many have asked me about the strategies I've been using. I'd like to shed some light on my
Dear followers,
During the weekend, I analyzed a list of stocks across various sectors that I believe are suitable for both traders and investors. Due to the overwhelming number of questions and individual requests, I must apologize that I cannot take on any additional requests
Sometimes people followed and unfollowed me instantly, which is a good sign for me to shake out those impatient and weaker guys. Stay tuned for more charts as I know my good followers have been waiting.
I often wonder about the strategy behind diversifying extensively in stock portfolios. From my experience in private banking, I've noticed that even the wealthiest individuals typically don't hold more than 20 stocks. The more stocks you own, the more diluted your gains become.
I used to ask my friends not to sell $PLTR even though it hits a resistance level at $30.06 (but some did), because whales know what we are thinking. Most retail investors have been expecting a dip between $25 and $27. I really don’t know whether whales will sell cheap to us. But
I work harder today because I have been busy searching for the tickers with the red candles. Surprisingly I found more than what I did yesterday. I don't want my followers to miss these golden chances. I have tried my best and hope that my efforts are not in vain.
$CLSK (17 July 2024-daily review)
An influencer recently cautioned that Bitcoin would plummet to the $43,000-$48,000 range by the end of June. He also shared selling most of his miner stocks at that time to secure profits, a strategy that totally makes sense.
CLSK has been