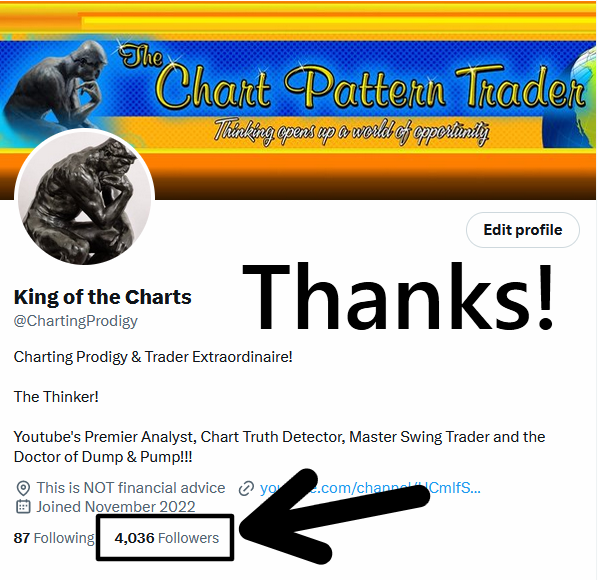
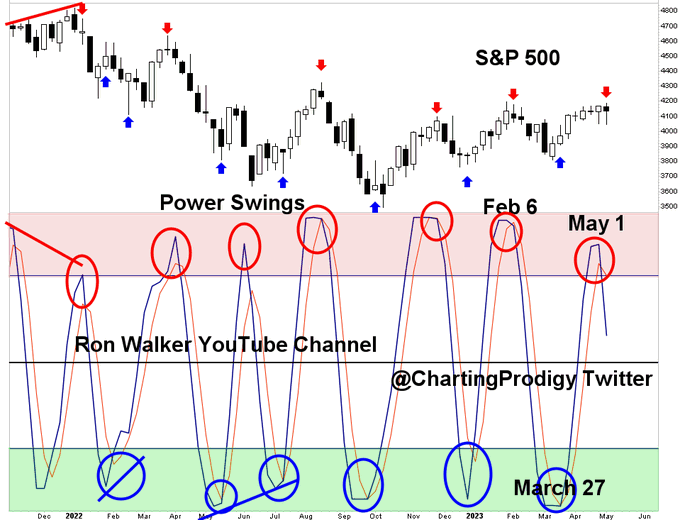
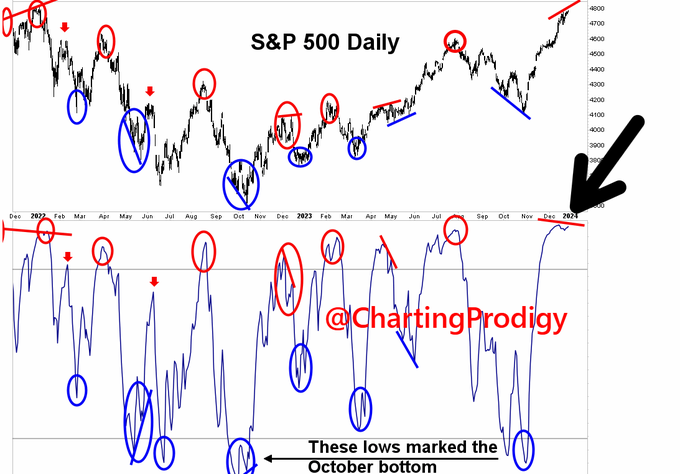
King of the Charts Profile Banner
King of the Charts Profile
King of the Charts

@ChartingProdigy

17,099
Followers
340
Following
2,383
Media
2,950
Statuses

Charting Prodigy & Trader Extraordinaire! The Thinker! Youtube's Premier Analyst, Chart Truth Detector, Master Swing Trader and the Doctor of Dump & Pump!!!

This is NOT financial advice
Joined November 2022
Don't wanna be here? Send us removal request.
Pinned Tweet
@ChartingProdigy
King of the Charts
2 years
Tweet media one
0
12
219
@ChartingProdigy
King of the Charts
14 days
. After the 1st rate cut Jan 3, 2001, S&P 500 got a 3.5 week bounce after already topping & dropping 19.53%. It lost 50.68%. After the 1st cut Sept 18, 2007, $SPX topped 3.5 weeks later & crashed 57.77% The herd believes the cuts are bullish, they are mistaken $QQQ #Powell #FOMC
Tweet media one
156
474
2K
@ChartingProdigy
King of the Charts
28 days
. The Herd is Celebrating that the Stock Market CRASH is Over They're in for another rude awakening. Just as they were shocked at the reversal when I called the top the day after the market peaked, they'll be surprised by the next leg down. Then it will bottom. $SPX $SPY $QQQ
Tweet media one
54
60
490
@ChartingProdigy
King of the Charts
9 months
CRASH Coming My Risk-Reward Model for #SP500 has reached extremes. Rollover likely this week after 5 up weeks Tops form by either reaching an extreme or rolling over at an extreme. The last 2 crosses allowed me to call the days of both the July top & Oct bottom . $SPX $SPY $QQQ
Tweet media one
0
84
421
@ChartingProdigy
King of the Charts
10 months
. Stock Market CRASH Over Bottom Here Here's My #SP500 #Elliottwave Count. Not To Be Confused With Imitations $SPY Finished an ABC Correction Friday or Will Monday. Fed Pause & Rally Into The End of the Year to New ATHs, Then a Top & Bear Market CRASH on a Fed Pivot $SPX $QQQ
Tweet media one
0
65
387
@ChartingProdigy
King of the Charts
1 year
$SPX $QQQ $VIX Banking Crisis Coming When investors are risk-on, money flows into riskier investments like stocks. When investors are risk-off, money flows into less-risky assets We are currently at levels where tops in the market form (arrow) & move into a risk-off environment
Tweet media one
0
77
327
@ChartingProdigy
King of the Charts
10 months
. I've correctly called the day of the July top & the day of the Oct bottom for #SP500 My #Elliottwave count, not to be confused with imitations, assumes $SPY will pullback, then a year end rally to new ATHs forming in Q1 2024. Followed by a rug pull & CRASH . $SPX $QQQ $AAPL
Tweet media one
0
41
299
@ChartingProdigy
King of the Charts
28 days
The Herd was blindsided by the crash after I called the top on NASDAQ & S&P 500 the day after they peaked. Now they tell us it's over! My signals correctly predicted the top. If the bottom is in why are my signals still bearish? I expect rejection @ 10 or 20 MA -arrows $SPX $SPY
Tweet media one
18
29
302
@ChartingProdigy
King of the Charts
1 year
$SPY $QQQ $SPXS $VIX High Probability the CRASH Starts Next Week #SP500 & #NASDAQ CRASH Could Start On or By July 19 or July 20 Triple negative divergences on S&P 500 IF IF IF a reversal starts Monday $SPX could BEGIN a CRASH move by Wednesday July 19 or Thursday July 20
Tweet media one
0
44
272
@ChartingProdigy
King of the Charts
20 days
. NASDAQ is in a Topping Process I Called A Top on the NASDAQ 100 the Day After it Topped July 10, 2024 After Tanking 15.75%, $NDX rebounded to 50 MA & 61.8% Fib. Expect more selling then a bigger rally to fill the gap @ 20,400, followed by more Distribution & a CRASH $SPX $QQQ
Tweet media one
0
44
273
@ChartingProdigy
King of the Charts
8 months
While I called the day of the July top, the day of the Oct bottom & predicted this rally. I will flip back to bearish soon because a major top is forming. The Herd is confident the rally will continue. Dumb Money is forming negative divergence like @ the July top . $SPX $SPY $QQQ
Tweet media one
0
44
251
@ChartingProdigy
King of the Charts
14 days
. I’m celebrating my 25th wedding anniversary with my beautiful wife this month on the island of Santorini, Greece. #anniversary #Santorini #Greece $SPX $SPY $QQQ $NDX .
Tweet media one
37
5
255
@ChartingProdigy
King of the Charts
9 months
. When Called the Day of the July Top I Got Free Hate From The Bulls Then When I Called The Day of the October Bottom The Bears Attacked Me I'm Ready For More Hate From the Bulls I'm Not Interested In The Bullish Side or the Bearish Side, Only the Right Side . $SPX $SPY $QQQ
Tweet media one
0
33
245
@ChartingProdigy
King of the Charts
29 days
. The VIX is predicting an 85% chance S&P 500 will be down on Monday. Thursday the $VIX dropped more than 10%, based on historical data, there is an 85% chance of a pullback or reversal within 2 sessions. A 15% chance the signal fails. $UVXY $SPX $SPY $QQQ #stockmarketcrash
Tweet media one
10
29
235
@ChartingProdigy
King of the Charts
1 year
Quadruple negative divergence on S&P 500 The strongest reversal signal in technical analysis. .
Tweet media one
0
57
224
@ChartingProdigy
King of the Charts
12 days
. The Stock Market is in a Topping Process The Fed Rate Cuts Historically Associated with Bear Market CRASHES. Both Occur Because Recession is About to Start Urgent Stock Market CRASH Video Here $SPX $SPY $QQQ $NDX #FOMC #Powell $AAPL $NVDA $VIX
Tweet media one
0
68
234
@ChartingProdigy
King of the Charts
9 months
. Powell speaks twice today. The first time to wreck the bears, the second time to wreck the bulls. The #SP500 is pushing slightly higher, the #NASDAQ100 is not. They are diverging from one another. This has marked tops & bottoms throughout 2023 . $SPX $SPY $QQQ #Powell #FOMC
Tweet media one
0
40
215
@ChartingProdigy
King of the Charts
1 year
$SPY $SPXS $QQQ $SQQQ $ES $AAPL $VIX $SPX My Power Swings Indicator rolled over on Monday suggesting that I should be looking for a top on #SP500 . Tops are marked when the indicator reaches extremes or rolls over. Sometimes it rolls over & price goes a little higher, then turns
Tweet media one
0
28
217
@ChartingProdigy
King of the Charts
1 year
$QQQ VIX Crash Signal Triggered Every time VIX tagged its 2017 trendline a crash followed. Sometimes $SPX moved a bit higher, then crashed The last time $VIX tested it was on Feb 2, that day #SP500 peaked with the Feb top Stock Market CRASH Video .
Tweet media one
0
34
208
@ChartingProdigy
King of the Charts
26 days
. My signals turned bearish after I called the top the day after the peak for both NASDAQ & S&P 500. Those signals are still bearish. $SPX will likely drop to test the 200 day MA @ 5K, then a bottom. Followed by a big rally to new ATHs to top w/ Sept cut then a CRASH $SPY #CPI
Tweet media one
0
34
216
@ChartingProdigy
King of the Charts
1 year
$SPY $SQQQ $QQQ $SPX #SP500 $NQ $ES $NDX CRASH Coming Not only is #NASDAQ 100 weekly chart getting a 9 Count Sell Signal. It has also formed or recently formed on the stocks leading the rally $AAPL, $MSFT, $AMZN & $META. The all have 9 Count Sell Signals on their weekly charts
Tweet media one
0
41
203
@ChartingProdigy
King of the Charts
26 days
. The Herd is Celebrating the Stock Market CRASH is Over Just as they were shocked @ the reversal when I called the top the day after the market peaked, they'll be surprised by the next DROP. Then $SPX will bottom & rally into Sept 18 (Fed Pivot), then $SPY will top & CRASH $QQQ
Tweet media one
0
23
208
@ChartingProdigy
King of the Charts
8 months
. MY SIGNALS ARE STILL BULLISH, but I think the stock market may try to peak next week, maybe on January 3 or 4. My analysis is subject to change based on data. But I called the day of the July top & day of Oct bottom correctly for $NDX & $SPX. Will I be right again? . $SPY $QQQ
Tweet media one
0
28
199
@ChartingProdigy
King of the Charts
14 days
. I really enjoyed the beautiful sunset on Santorini, Greece. My beautiful wife captured it in this picture. We are celebrating our 25th wedding anniversary this month. #anniversary #Santorini #Greece $SPX $QQQ &SPY
Tweet media one
13
9
206
@ChartingProdigy
King of the Charts
5 months
. SPY Here's another one of my trading system charts. It doesn't get much better than this folks. Please let me know that want me to keep posting my trading system charts by clicking on the❤️button. . $SPX $SPY $QQQ $NDX #Powell #PCE #GPD #trading #stockmarket #SwingTrading $AAPL
Tweet media one
0
5
195
@ChartingProdigy
King of the Charts
10 months
. I've correctly called the day of the July top & the day of the Oct bottom for #NASDAQ100 My #Elliottwave count, not to be confused with imitations, assumes $NDX will pullback, then a year end rally to new ATHs forming a bearish Rising Wedge Followed by a CRASH . $SPX $QQQ $SPY
Tweet media one
0
23
191
@ChartingProdigy
King of the Charts
1 year
$SPX $QQQ $SPY #ratehikes Often There Is A Post Fed Selloff Within Days After A Hawkish Fed The Suppy-Demand Index is at extremes ahead of #Fed Chair #Powell 's 2-day Congressional Testimony next week. Higher levels than the extremes that formed the top during Nov 21 & Jan 22
Tweet media one
0
37
182
@ChartingProdigy
King of the Charts
10 months
. I Can't Believe How Few Are Following My Signals My Amazing Signals Allowed Me To Call the July top & the October Bottom Correctly I've correctly called the turns along the way Unlike most, I have the guts to tell you what I think right or wrong. My calls below $SPX $SPY $QQQ
Tweet media one
0
20
188
@ChartingProdigy
King of the Charts
2 months
NVDA & $NDX Have Topped & Started Bear Markets $NVDA Topped on June 20, 2024 NASDAQ 100 Topped July 11, 2024 S&P 500 Will Likely Top in the Next 3 Sessions #Nvidia will cause the entire stock market to crash. It is backtesting a Rising Wedge getting a lower high $SPX $SPY $QQQ
Tweet media one
0
39
187
@ChartingProdigy
King of the Charts
10 months
. I've now correctly called the day of the July top & the day of the Oct bottom for S&P 500 My #Elliottwave count, not to be confused with imitations, assumes $SPX will pullback & then a year end rally to new ATHs My Oct bottom call in the link $SPY $QQQ
Tweet media one
@ChartingProdigy
King of the Charts
10 months
. Stock Market CRASH Over Bottom Here Here's My #SP500 #Elliottwave Count. Not To Be Confused With Imitations $SPY Finished an ABC Correction Friday or Will Monday. Fed Pause & Rally Into The End of the Year to New ATHs, Then a Top & Bear Market CRASH on a Fed Pivot $SPX $QQQ
Tweet media one
0
65
387
0
22
178
@ChartingProdigy
King of the Charts
1 year
$SPX $SPY $QQQ $AAPL CRASH STARTS JULY 3 As I said in my last tweet, I think we #SP500 move above today's intraday high at 4590 & close strong the last hr completing wave 2. Setting up for the start of the crash on Monday & Tuesday. Next week will start a long term crash move.
Tweet media one
0
28
178
@ChartingProdigy
King of the Charts
25 days
. As mentioned yesterday, NASDAQ 100's rally will likely stall near the 20 MA, which is right where these 2 trendlines intersect & the gap fill @ 18,890. Then a dump below the 200 MA to 17K, then a Jackson Hole bottom & rally into the Sept Fed rate cut, top & crash $SPX $QQQ $NDX
Tweet media one
0
31
179
@ChartingProdigy
King of the Charts
9 months
Every time the #DowJones passes through one of these blue Fib rings in the last 2 years it dumps, rolls down the path of the ring, bottoms & bounces off it, rising to the next ring. Then it repeats. Expect a dump as it just crossed through the ring again. . $SPX $SPY $QQQ $DJIA
Tweet media one
0
35
171
@ChartingProdigy
King of the Charts
4 months
. Success! My Trend Master Indicator It marks price extremes & trend reversals. Live it, Love it, Learn it. I love my indicators. If you do too & want to see more then give this post a ❤️. $SPX $SPY $QQQ $SPXL $SPXS #Swingtrading #stockmarket $ES_F $NQ_F $NQ #Powell #CPI
Tweet media one
0
8
173
@ChartingProdigy
King of the Charts
11 months
. Here is my bullish Elliott Wave Count for the S&P 500. This count assumes $SPX will bottom around the 200 MA, it may have already (see alternative count). This counts suggests a massive rally into the end of the year for a double top. A Fed pause & earnings could do that. $SPY
Tweet media one
0
29
167
@ChartingProdigy
King of the Charts
29 days
. I correctly called the top for the NASDAQ 100 the day after it peaked on July 10 & for S&P 500 on July 17 The experts on X that never saw this crash coming are now proclaiming it's over. It's not. We are in a Risk Off Environment & the trend is still down $SPX $SPY $QQQ #CPI
Tweet media one
0
21
169
@ChartingProdigy
King of the Charts
9 months
. #Powell is going to be the Grinch that stole Christmas Market Sentiment is forming negative divergence at extremes. It is still a work in progress, but could finish with the #CPI data or the #FOMC on Wed. #Fed will push back on the idea of 125BP rate cuts in 2024 $SPX $SPY $QQQ
Tweet media one
0
35
160
@ChartingProdigy
King of the Charts
1 year
$SPX $QQQ It's a shame when haters, naysayers & trolls drive away a good analyst like @MauroBianchi24 . This kid had only been doing TA for 2 yrs & has real talent. It's sad that mean-spirited ppl viciously attacked Him so much that He quit posting. I think I'll join you Mauro!
Tweet media one
1
8
160
@ChartingProdigy
King of the Charts
1 year
$QQQ Every time the VIX bounced off of its 2017 trendline or pullback towards it, a big selloff followed. Sometimes the $SPX moved a bit higher, then sold off The last time the $VIX tagged it was on Feb 2, that day #SP500 peaked with the Feb top VIX is about to tag it again! .
Tweet media one
0
31
160
@ChartingProdigy
King of the Charts
10 months
. Since I Called the Day of the S&P 500 Bottom on Oct 27th, it has rallied 11 %. Power Swings show it overbought & at the levels when I called the day of the top on July 27th. My signals remain bullish, but that will soon change. Expect a pullback then new ATHs . $SPX $SPY $QQQ
Tweet media one
0
10
156
@ChartingProdigy
King of the Charts
11 months
. Don't Follow the Herd The Herd was bullish at the July top when I called the day of the top. The Herd said we would be at ATHs before summer ended & scoffed at a crash Now they say the market us going to crash after it crashed. The market is likely bottoming. $SPX $SPY $QQQ
Tweet media one
0
26
154
@ChartingProdigy
King of the Charts
1 year
$SPX $SPY $QQQ $NDX $VIX $AAPL $SPXS My Dump & Pump Signals for both the #SP500 & #NASDAQ100 got a bearish sell signals today. Again, I expect a selloff this week to confirm the topping tail candlestick on the NASDAQ 100's weekly chart. This will START a long term Super CRASH .
Tweet media one
0
17
156
@ChartingProdigy
King of the Charts
24 days
. Let me explain to you why the selloff isn't over yet. The S&P 500 hourly is still below the 200 MA (black line), so is the 50 MA (green). Pring Osc is still in the negative region. $SPX is forming Rising Wedge in a larger Bear Flag. The bullish criteria is below $SPY $QQQ $ES_F
Tweet media one
0
18
160
@ChartingProdigy
King of the Charts
24 days
. The NASDAQ 100 Rally is a Pump & Dump NDX backtest. The August low will be tested for a lower low or higher low. Then a bottom forms, maybe w/ Powell @ Jackson Hole. Then a bottom & rally to 20.4K to fill the gap, a top followed by a crash & bear market $SPX $QQQ $NDX $SPY
Tweet media one
0
24
151
@ChartingProdigy
King of the Charts
10 months
. Doing What I Was Meant To Do! Thank You To My First 9000 Twitter Followers Reached Today. Thank You For Your Interest In My Charts Success Ron Walker PhD The Doctor Of Dump & Pump . $SPY $NDX $SPXS $SQQQ $BTC #Bitcoin $QQQ $AAPL $SPX $BTC $SQQQ #SP500 $TQQQ $VIX $NVDA $ES_F
Tweet media one
34
2
147
@ChartingProdigy
King of the Charts
2 months
. NVDA TOP This Time is Different Because of AI. POPPYCOCK! That's propaganda by professional money for the retail investors (the Kool-Aid drinkers) NVDA down 4.50% today. I've been warning that NVDA will crash stocks over the summer & the top is likely in on $NVDA $QQQ $SPY $SPX
Tweet media one
0
29
150
@ChartingProdigy
King of the Charts
1 month
. NASDAQ 100 Bottom Forming New lows on the NASDAQ 100 as predicted NASDAQ 100 Topped on July 10, 2024 as Predicted I think a bottom will form w/ bullish divergences, followed by big countertrend back up to 20,398 to fill the gaps for a lower high. $SPX $SPY $QQQ $NDX $NQ_F
Tweet media one
0
30
151
@ChartingProdigy
King of the Charts
1 year
$SPXS $SPY The #SP500 has rallied back up near the Feb highs, but only 54 % of the stocks on $SPX are in uptrends (black arrow). If it doesn't reach extremes (red line) it could mark this a countertrend like the Feb & May tops. Major tops circled in red, minor tops in black .
Tweet media one
0
23
139
@ChartingProdigy
King of the Charts
1 year
$SPY $NDX $SPXS $SQQQ $BTC $SPXL $QQQ $AAPL $SPX #StockMarketcrash $SQQQ #SP500 $TQQQ $VIX Thank You To My First 3000 Twitter Followers Reached Yesterday. Thank You For Your Interest In My Work. Much Appreciated! Continued Success, Ron Walker PhD The Doctor Of Dump & Pump .
Tweet media one
0
3
141
@ChartingProdigy
King of the Charts
10 months
@fernandowavesfx Excellent work. But my guess is a melt up first to new ATHs, then a crash & bear market after Q1 2024. The market is going to selloff ahead of the Dec Fed meeting& likely get a higher low with a Fed pause. Then crash on Fed pivot in 2024. Outstanding work. You may be right!
19
3
144
@ChartingProdigy
King of the Charts
3 months
. S&P 500 is slightly under the long term rising resistance trendline from the 2000 top. There is a small recent negative divergence on RSI in a larger one. Each divergence resulted in a big selloff. This multiple point divergence will usher in a bear market $SPX $SPY $ES_F $QQQ
Tweet media one
0
25
142
@ChartingProdigy
King of the Charts
9 months
. Dumb Money Has Marked Tops & Bottoms My Dumb Money Indicator reached extremes, but hasn't formed negative divergence yet, which marked tops in 2022 & 2023. So I think $SPX will reach a new ATH & the upper end of my channel (link) then crash . $SPY $QQQ
Tweet media one
@ChartingProdigy
King of the Charts
9 months
. On Oct 28, I posted my #Elliottwave count (not to be confused with imitations), announcing my call for a $SPY bottom on Oct 27 & a rally to new all time highs by the end of the year (link). Compare the charts, it played out just as I predicted $SPX $QQQ
Tweet media one
0
19
124
0
21
139
@ChartingProdigy
King of the Charts
25 days
. S&P 500 will likely stall near the 20 day MA currently at 5413.64. Then drop back to test the 200 day MA (black line) in the low 5K area. Then bottom with Jackson Hole next week & rally into the Sept 18 rate cut, then top & crash $SPX $SPY $QQQ $ES_F #PPI #CPI #stockmarketcrash
Tweet media one
0
19
143
@ChartingProdigy
King of the Charts
1 year
$SPY $NDX $SPXS $SQQQ $BTC $SPXL $QQQ $AAPL $SPX #StockMarketcrash $SQQQ #SP500 $TQQQ $VIX Thank You To My First 4000 Twitter Followers Recently Reached. Thank You For Your Interest In My Work. Much Appreciated! Continued Success, Ron Walker PhD The Doctor Of Dump & Pump .
Tweet media one
0
6
138
@ChartingProdigy
King of the Charts
9 months
. Stock Market Signaling A Top The #SP500 is Now Diverging With The #NASDAQ100 as It Has At Other Tops & Bottom URGENT Stock Market Crash Video Here . . . $SPX $SPY $NDX $QQQ $VIX #Powell #rates #FOMC $AAPL $NVDA $ES_F $NQ_F $TQQQ $SQQQ $SPXL $SPXS $VOO
Tweet media one
0
15
138
@ChartingProdigy
King of the Charts
27 days
. SPX Rejection @ 10 or 20 MA If the S&P 500 can clear the 10 day MA (red line), then it may attempt to rally towards the 20 day MA (blue line), which is where the 61.8% fib is at, near the next gap fill area at 5447 or it's intraday low at 5413. $SPX $SPY $ES_F $QQQ #Powell
Tweet media one
7
18
141
@ChartingProdigy
King of the Charts
9 months
My Elliott Wave Count not to be confused with imitations I predicted an $SPX rally to new ATHs after I called the Oct 27 bottom. S&P 500 will likely make a new ATH by next week hitting the upper channel (last post), then peak & reverse. My alternative EW count is $SPY peaked Wed
Tweet media one
0
15
134
@ChartingProdigy
King of the Charts
10 months
. Hey Bears My Bull Count Doesn't Seem So CRAZY To You Now I tried to warn you about this rally. S&P 500 up 5% this week I warned that I covered my shorts last Thursday & Friday & went long, but many bears didn't heed the warning. Don't worry pullback coming . $SPX $SPY $QQQ
Tweet media one
0
17
139
@ChartingProdigy
King of the Charts
4 months
. My S&P 500 Trending Candlesticks Model shows momentum is up (green bars & line), but the sell signal from the highs remains. The buy & sell signals have marked turns. Let me know if U want to see more of my trading models by clicking the ❤️ button $SPX $SPY $ES_F #FOMC $QQQ
Tweet media one
0
2
140
@ChartingProdigy
King of the Charts
8 months
. SELL!!! QQQ SELL SIGNAL . My NASDAQ 100 Overbought / Oversold Model Triggered A Sell Signal for NDX by turning down at extremes. This signals a top or it can still form a divergence . $SPX $SPY $NDX $TQQQ $SQQQ $NQ_F $ES_F #BULLRUN2024 #Stockmarketcrash $AAPL $NVDA #SP500 $QQQ
Tweet media one
0
13
135
@ChartingProdigy
King of the Charts
1 year
$NDX $SPXS $QQQ $SQQQ $SPX $NQ_F #SP500 $AAPL $TQQQ #NASDAQ 100 weekly chart starts the week off with a bearish Stochastic cross, suggesting the another crash. Since I called the day of the top in Nov. 2021, each Stochastic crossover was followed by a crash (red circles). .
Tweet media one
0
18
135
@ChartingProdigy
King of the Charts
10 months
. Fed Pause / Market Bottom Last week I predicted a bottom on Friday or Monday. Bouncing off major support. Good shot S&P 500 is completing wave (4) and it rallies into the end of the year for w(5) to new ATHs on the Fed Pause I've been predicting for Nov 1. . $SPX $SPY $QQQ
Tweet media one
0
16
134
@ChartingProdigy
King of the Charts
1 year
$QQQ $SPY $NDX $AAPL The #SP500 is extremely overbought. The last 2 times it was this overbought & at these extremes was at the top, when it formed a neg divergence & it crashed by -24.55%. Then at the August high, $SPX reversed reaching these extremes & crashed by nearly -20%.
Tweet media one
0
19
135
@ChartingProdigy
King of the Charts
9 months
Possible Double Top I called the day of the bottom on Oct 27th & predicted a rally to new ATHs for S&P 500. It played out. I expect profit taking in the new year. $SPX weekly has horizontal resistance overhead, the upper channel & a trendline from before the pandemic $SPY $QQQ
Tweet media one
0
24
131
@ChartingProdigy
King of the Charts
1 year
$SPY $SPXS $QQQ $AAPL $SPX #StockMarketcrash #SP500 It never ceases to amaze me how complacent people get at tops The $VIX has formed bullish divergences in the weekly timeframe, while the Herd is shuffling the deck chairs on the Titanic, oblivious to what is about to happen. .
Tweet media one
0
21
130
@ChartingProdigy
King of the Charts
15 days
. S&P 500 Topping Process Triple Bearish Divergences Likely to Form Early Next Week on S&P 500 & NASDAQ 100 Ahead of NVDA Earnings Stock Market Video Here Bitcoin Video Last Post $SPX $SPY $QQQ $NDX $AAPL #Powell #NVDA #FOMC $VIX $SQQQ $TQQQ $SPXL $SPXS
Tweet media one
0
23
136
@ChartingProdigy
King of the Charts
8 months
. CRASH COMING!!! The S&P 500 is very overbought and at extremes once again. Major selloff coming soon! . $SPX $SPY $QQQ $NDX $AAPL #BULLRUN2024 #Stockmarketcrash $MSFT $NVDA $GOOG $TSLA $META $SPXL $SPXS $VIX $SPXS $SPXU $NQ_F $ES_F
Tweet media one
0
12
126
@ChartingProdigy
King of the Charts
8 months
. My Risk-Reward Model rolled over on Jan 2 to start the year. Tops are marked @ extremes or rollovers after extremes. Here we were @ extremes for 5 weeks. The rollover marked a top. #SP500 still may make an ATH & form a divergence like it did @ the Oct low in 2023 $SPX $SPY $QQQ
Tweet media one
0
17
130
@ChartingProdigy
King of the Charts
30 days
. Nothing has changed. I told you I expected S&P 500 to rally to test the 50 MA (green line), cloud & fill the gap @ 5345 or higher on hourly. Once done, a new low to form a bullish divergence here & test the 200 day MA on the daily near 5K. $SPX $SPY $QQQ #SP500 #stockmaretcrash
Tweet media one
6
18
132